This is a very brief overview of features available in the poligrain package. A more comprehensive overview of can be found in the poligrain documentation.
import matplotlib.pyplot as plt

import poligrain as plg
Explore example datasets
We provide the option to download subsets of existing open datasets with opportunistic sensor data. Currently, the following open datasets are supported:
OpenMRG: CML, rain gauge and radar data in Gothenburg, Sweden (Andersson et al., 2022) Andersson et al. (2022)
OpenRainER: CML and rain gauge data in Emilia-Romagna, Italy (Covi et al., 2026) Covi et al. (2026)
Amsterdam PWS data: PWS data in Amsterdam, Netherlands (de Vos et al., 2019) https://
data .4tu .nl /articles /dataset /Rainfall _observations _datasets _from _Personal _Weather _Stations /12703250 OpenMesh: CML, PWS and ASOS reference station data in New York City, USA (Jacoby et al., 2026) Jacoby et al. (2025)
Below we briefly show how to load a subset of the OpenMRG dataset.
(
    ds_rad,
    ds_cmls,
    ds_gauges_municp,
    ds_gauge_smhi,
) = plg.example_data.load_openmrg(data_dir="example_data", subset="8d")
File already exists at example_data/openmrg_rad_8d.nc
Not downloading!
The CML data is provided in a xarray.Dataset following the OpenSense naming conventions defined by (Fencl et al., 2023).
Note that this example dataset has already been processed and the rain rates R per CML are stored. Normally are raw CML dataset would only contain RSL and TSL data.
ds_cmlsPlot point, line and grid data on a map
One key feature of poligrain is the ability to plot point, line and grid data on a map. Plotting points and grids is straightforward with matplotlib. A fast and flexible way to plot line data was missing before.
Below we show an example of how to plot the rainfall accumulatoin of CMLs, rain gauges and radar on a map.
plg.plot_map.plot_plg(
    da_cmls=ds_cmls.isel(sublink_id=0).R.resample(time="1h").mean().sum(dim="time"),
    da_grid=ds_rad.R.resample(time="1h").mean().sum(dim="time"),
    da_gauges=ds_gauges_municp.rainfall_amount.sum(dim="time"),
    vmin=0,
    vmax=120,
)
<Axes: xlabel='lon', ylabel='lat'>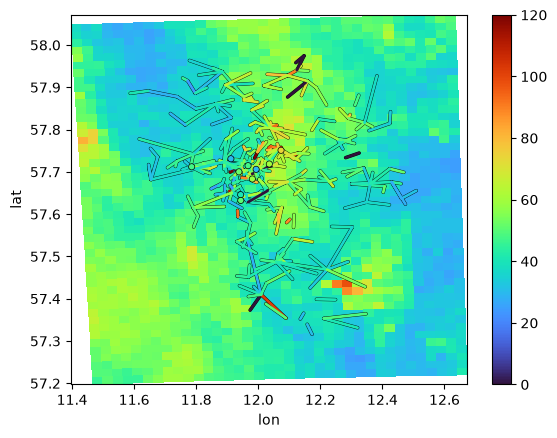
Calculate distances between points and lines
# Project coordinates for rain gauges
ds_gauges_municp.coords["x"], ds_gauges_municp.coords["y"] = plg.spatial.project_point_coordinates(
    ds_gauges_municp.lon, ds_gauges_municp.lat, "EPSG:25832"
)

# Project coordinates for CMLs
(
    ds_cmls.coords["site_0_x"],
    ds_cmls.coords["site_0_y"],
) = plg.spatial.project_point_coordinates(
    ds_cmls.site_0_lon, ds_cmls.site_0_lat, "EPSG:25832"
)
(
    ds_cmls.coords["site_1_x"],
    ds_cmls.coords["site_1_y"],
) = plg.spatial.project_point_coordinates(
    ds_cmls.site_1_lon, ds_cmls.site_1_lat, "EPSG:25832"
)
point-to-point distances
closest_neigbors = plg.spatial.get_closest_points_to_point(
    ds_points=ds_gauges_municp,
    ds_points_neighbors=ds_gauges_municp,
    max_distance=20e3,
    n_closest=12,
)

closest_neigbors.distance.plot();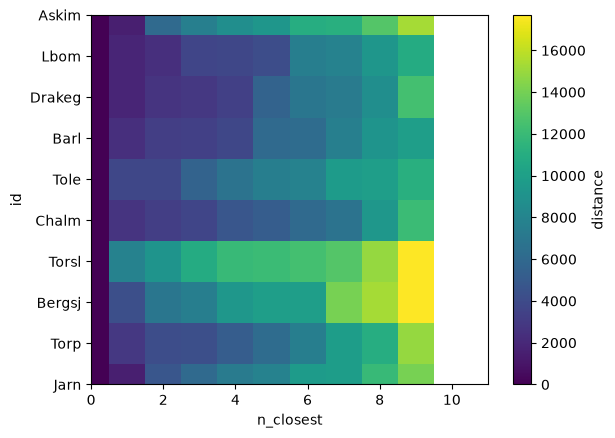
point-to-line distances
closest_neigbors = plg.spatial.get_closest_points_to_line(
    ds_cmls, ds_gauges_municp, max_distance=20e3, n_closest=10,
)

closest_neigbors.distance.plot()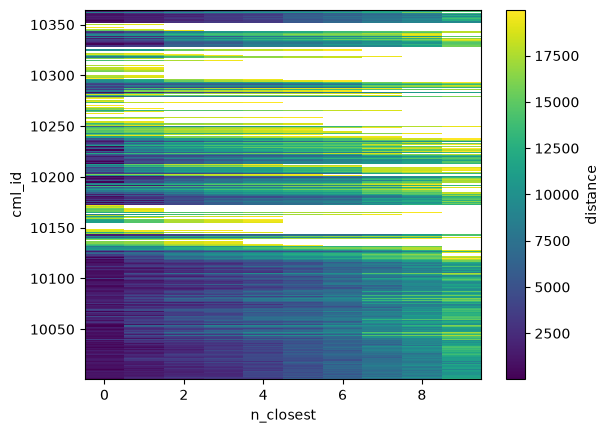
cml_id = 10089
cml_id = 10098
cml_id = 10073

plg.plot_map.plot_plg(
    da_cmls=ds_cmls.sel(cml_id=cml_id),
    use_lon_lat=False,
)

gauge_id = closest_neigbors.sel(cml_id=cml_id).dropna(dim='n_closest').neighbor_id.values
gauge_distance = closest_neigbors.sel(cml_id=cml_id).dropna(dim='n_closest').distance.values

sc = plt.scatter(
    ds_gauges_municp.sel(id=gauge_id).x,
    ds_gauges_municp.sel(id=gauge_id).y,
    c=gauge_distance,
    cmap="viridis",
    vmin=1.4e3,
    vmax=5.1e3,
)
plt.colorbar(sc, label="Distance to CML [m]")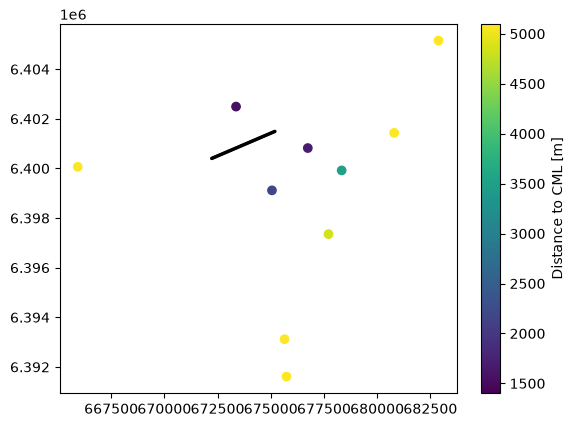
- Andersson, J. C. M., Olsson, J., van de Beek, R. (C. Z. ), & Hansryd, J. (2022). OpenMRG: Open data from Microwave links, Radar, and Gauges for rainfall quantification in Gothenburg, Sweden. Earth System Science Data, 14(12), 5411–5426. 10.5194/essd-14-5411-2022
- Covi, E., Roversi, G., & Nebuloni, R. (2026). OpenRainER: an open-source dataset for studying the opportunistic sensing of rainfall in Emilia-Romagna, Italy. 10.5194/essd-2026-160
- Jacoby, D., Yu, S., Hu, Q., Hine, Z., Johnson, R., Ostrometzky, J., Kadota, I., Zussman, G., & Messer, H. (2025). OpenMesh: Wireless Signal Dataset for Opportunistic Urban Weather Sensing in New York City. 10.5194/essd-2025-238
- Fencl, M., Nebuloni, R., C. M. Andersson, J., Bares, V., Blettner, N., Cazzaniga, G., Chwala, C., Colli, M., de Vos, L., El Hachem, A., Galdies, C., Giannetti, F., Graf, M., Jacoby, D., Victor Habi, H., Musil, P., Ostrometzky, J., Roversi, G., Sapienza, F., … Zheng, X. (2024). Data formats and standards for opportunistic rainfall sensors. Open Research Europe, 3, 169. 10.12688/openreseurope.16068.2