import matplotlib.pyplot as plt

import poligrain as plg
import pypwsqc
import mergeplg
import pycomlink as pycml

# Suppress numpy and pypwsqc runtime warnings
import warnings
warnings.filterwarnings('ignore', category=RuntimeWarning, module='numpy')
warnings.filterwarnings('ignore', category=RuntimeWarning, module='pypwsqc')
Load open OpenMRG example data and project coordinates
We load 8 days of the OpenMRG dataset and do some quick visualization of the data using poligrain.
(
    ds_rad,
    ds_cmls,
    ds_gauges_municp,
    ds_gauge_smhi,
) = plg.example_data.load_openmrg(data_dir="example_data", subset="8d")
# Project data to coordinate system
# UTM32N: https://epsg.io/32632
ref_str = "EPSG:32632"
# gauges
ds_gauges_municp.coords["x"], ds_gauges_municp.coords["y"] = plg.spatial.project_point_coordinates(
ds_gauges_municp.lon, ds_gauges_municp.lat, ref_str
)
# CMLs
ds_cmls.coords["site_0_x"], ds_cmls.coords["site_0_y"] = plg.spatial.project_point_coordinates(
ds_cmls.site_0_lon, ds_cmls.site_0_lat, ref_str
)
ds_cmls.coords["site_1_x"], ds_cmls.coords["site_1_y"] = plg.spatial.project_point_coordinates(
ds_cmls.site_1_lon, ds_cmls.site_1_lat, ref_str
)
# Radar
ds_rad.coords["x_grid"], ds_rad.coords["y_grid"] = plg.spatial.project_point_coordinates(
ds_rad.lon, ds_rad.lat, ref_str
)plg.plot_map.plot_plg(
da_grid=ds_rad.R.resample(time='1h').mean().sum(dim="time"),
da_gauges=ds_gauges_municp.rainfall_amount.sum(dim='time'),
da_cmls=ds_cmls,
vmin=0,
vmax=100,
cmap='YlGnBu',
kwargs_cmls_plot={"line_color": "k", "line_width": 1},
kwargs_gauges_plot={"edge_color": "r", "s": 30},
)<Axes: xlabel='lon', ylabel='lat'>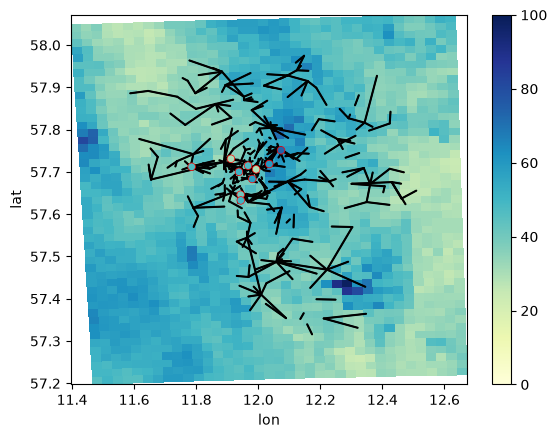
CML processing
Here we do a standard CML processing with, what we believe, are reasonable methods and parameters. Note that, we use the radar as wet-dry indicator and we use poligrain to extract the path-averaged radar data for each CML which is needed for that.
ds_cmls['tl'] = ds_cmls.tsl - ds_cmls.rsl

# get radar along CMLs
grid_at_lines = plg.spatial.GridAtLines(
    da_gridded_data=ds_rad.R,
    ds_line_data=ds_cmls,
)
da_radar_along_cmls = grid_at_lines(ds_rad.R)

# wet-dry classification based on
# smoothed radar rain rates along each CML
ds_cmls['wet'] = (
    (da_radar_along_cmls > 0.1)
    .rolling(time=6*3, center=True)
    .max()
)
ds_cmls['wet'] = ds_cmls.wet.ffill(dim='time')

#ds_cmls['wet'] = ds_cmls.tl.rolling(time=10*60).std() > 0.3

# calculate baseline
ds_cmls["baseline"] = pycml.processing.baseline.baseline_constant(
    trsl=ds_cmls.tl,
    wet=ds_cmls.wet,
    n_average_last_dry=5,
)

# calculate wet antenna effect
ds_cmls["A_obs"] = ds_cmls.tl - ds_cmls.baseline
ds_cmls["A_obs"] = ds_cmls.A_obs.where(ds_cmls.A_obs >= 0, 0)
ds_cmls["waa"] = pycml.processing.wet_antenna.waa_pastorek_2021_from_A_obs(
    A_obs=ds_cmls.A_obs,
    f_Hz=ds_cmls.frequency * 1e6,
    pol=ds_cmls.polarization.data,
    L_km=ds_cmls.length / 1000,
    A_max=6,
    zeta=0.7,
    d=0.15,
)

# calculate attenuation caused by rain and remove negative attenuation
ds_cmls["A"] = ds_cmls.tl - ds_cmls.baseline - ds_cmls.waa
ds_cmls["A"].data[ds_cmls.A < 0] = 0
# derive rain rate via the k-R relation
ds_cmls["R"] = pycml.processing.k_R_relation.calc_R_from_A(
    A=ds_cmls.A,
    L_km=ds_cmls.length.astype(float) / 1000,
    f_GHz=ds_cmls.frequency / 1000,
    pol=ds_cmls.polarization,
)
ds_cmls["R"].data[ds_cmls.R < 0.1] = 0

# Calcualte rainfall sums for plotting
rad_sum = ds_rad.R.resample(time='1h').mean().sum(dim='time')
cml_sum = ds_cmls.R.isel(sublink_id=0).resample(time='1h').mean().sum(dim='time', skipna=False)
rad_along_cml_sum = da_radar_along_cmls.resample(time='1h').mean().sum(dim='time')
# Plot data on maps
fig, axs = plt.subplots(1, 3, figsize=(18, 5), sharex=True, sharey=True)
plg.plot_map.plot_plg(
da_grid=rad_sum,
da_cmls=cml_sum,
vmin=0,
vmax=100,
ax=axs[0],
kwargs_cmls_plot={"line_width": 1},
)
plg.plot_map.plot_plg(
da_grid=rad_sum,
da_cmls=rad_along_cml_sum,
kwargs_cmls_plot={"line_width": 1},
vmin=0,
vmax=100,
ax=axs[1],
)
plg.plot_map.plot_plg(
#da_grid=rad_sum,
da_cmls=cml_sum - rad_along_cml_sum,
kwargs_cmls_plot={"line_width": 3, "vmin": -30, "vmax": 30, "cmap": 'RdBu'},
vmin=0,
vmax=100,
#cmap="Grays",
ax=axs[2],
)<Axes: >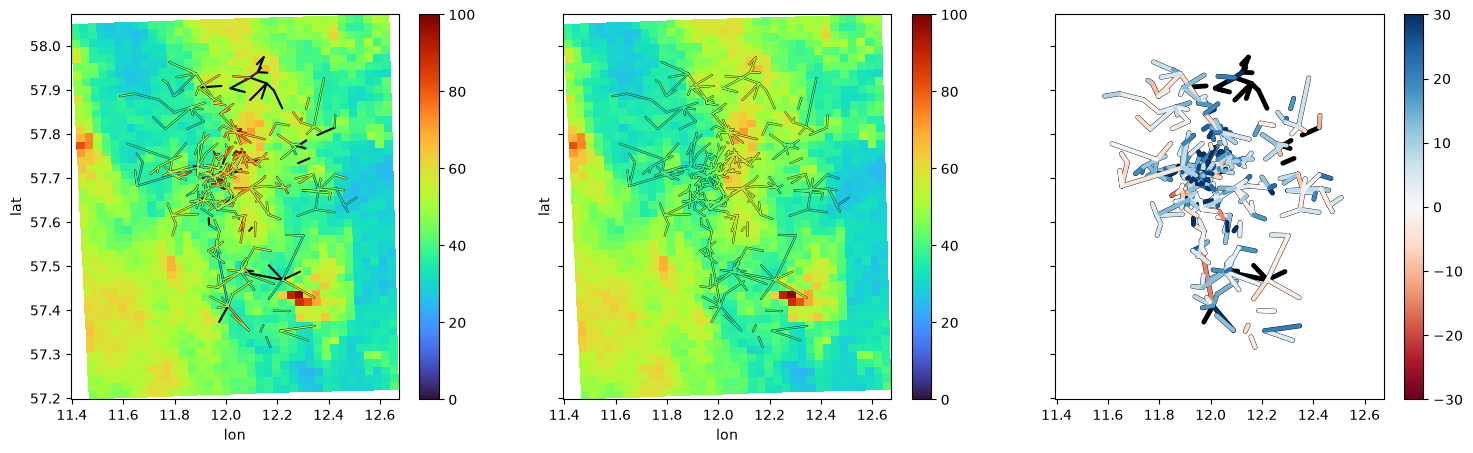
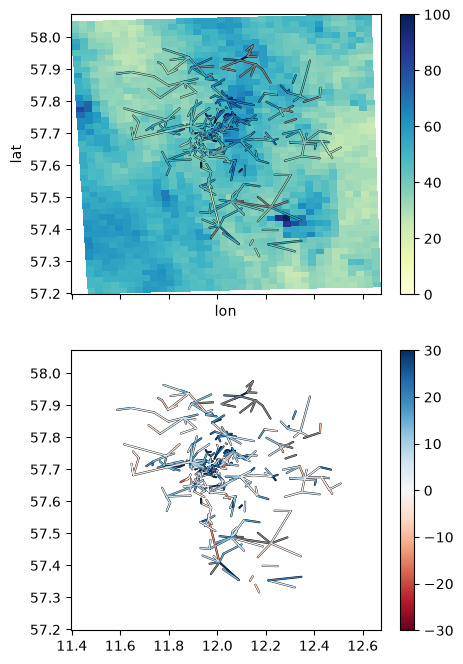
# plot for paper
import matplotlib as mpl
R_cmap = mpl.colormaps.get_cmap('YlGnBu')
R_cmap.set_bad(color='gray')
diff_cmap = mpl.colormaps.get_cmap('RdBu')
diff_cmap.set_bad(color='gray')

# Plot data on maps
fig, axs = plt.subplots(2, 1, figsize=(5, 8), sharex=True, sharey=True)

plg.plot_map.plot_plg(
    da_grid=rad_sum,
    da_cmls=cml_sum,
    vmin=0,
    vmax=100,
    ax=axs[0],
    cmap=R_cmap,
    kwargs_cmls_plot={"line_width": 1},
)

plg.plot_map.plot_plg(
    #da_grid=rad_sum,
    da_cmls=cml_sum - rad_along_cml_sum,
    kwargs_cmls_plot={"line_width": 1, "vmin": -30, "vmax": 30, "cmap": diff_cmap},
    vmin=0,
    vmax=100,
    ax=axs[1],
);
Apply the indicator correlation filter to detect outliers
Note that the indicator correlation filter was developed for quality control of PWS data, but we will use it here for the processed CML rainfall data to examplify the usage of tools.
import pypwsqc.indicator_correlation as ic# Calculate CML midpoint which is then used to treat CMLs as virtual points with coordinate x and y
ds_cmls.coords["x"] = (ds_cmls.site_0_x + ds_cmls.site_1_x) / 2
ds_cmls.coords["y"] = (ds_cmls.site_0_y + ds_cmls.site_1_y) / 2# Aggregate to 15 minutes
da_gauges = 4 * ds_gauges_municp.rainfall_amount.resample(time='15min').sum()
da_cmls = (
ds_cmls.R.isel(sublink_id=0, drop=True)
.resample(time='15min').mean()
.rename({'cml_id': 'id'})
)
# Calculate indicator correlation and distance matrix
dist_mtx_ref, indcorr_mtx_ref = ic.indicator_distance_matrix(
da_gauges,
da_gauges,
max_distance=30e3,
prob=0.95,
min_valid_overlap=6 * 24,
) 0%| | 0/10 [00:00<?, ?it/s]100%|██████████| 10/10 [00:00<00:00, 142.33it/s]
plt.scatter(dist_mtx_ref, indcorr_mtx_ref, color="red", s=10, label="Ref")
plt.ylim(0, 1)
plt.xlim(0, 30e3)
plt.ylabel("Indicator Correlation [-]")
plt.xlabel("Distance [m]")
plt.title("Indicator correlation for reference data vs reference data")
plt.legend();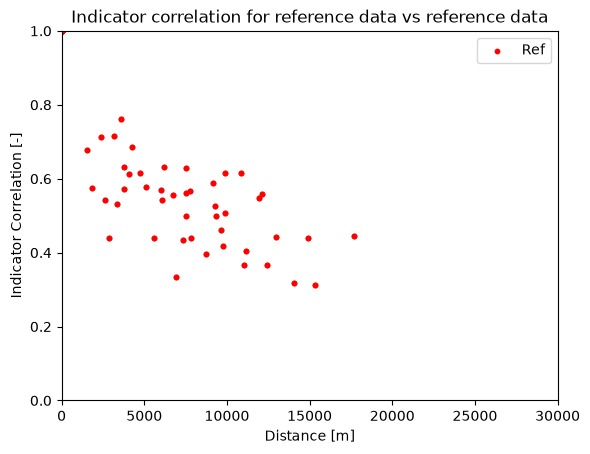
# Distance and indicator correlations of reference data
dist_mtx, indcorr_mtx = ic.indicator_distance_matrix(
    da_gauges,
    da_cmls,
    max_distance=30e3,
    prob=0.95,
    min_valid_overlap=6 * 24,
)
0%| | 0/10 [00:00<?, ?it/s] 10%|█ | 1/10 [00:00<00:02, 3.88it/s] 20%|██ | 2/10 [00:00<00:02, 3.75it/s] 30%|███ | 3/10 [00:00<00:01, 3.76it/s] 40%|████ | 4/10 [00:01<00:01, 3.95it/s] 50%|█████ | 5/10 [00:01<00:01, 3.85it/s] 60%|██████ | 6/10 [00:01<00:01, 3.85it/s] 70%|███████ | 7/10 [00:01<00:00, 3.82it/s] 80%|████████ | 8/10 [00:02<00:00, 3.79it/s] 90%|█████████ | 9/10 [00:02<00:00, 3.76it/s]100%|██████████| 10/10 [00:02<00:00, 3.83it/s]100%|██████████| 10/10 [00:02<00:00, 3.82it/s]
plt.scatter(dist_mtx, indcorr_mtx, color="b", alpha=0.2, s=10, label="CML")
plt.scatter(dist_mtx_ref, indcorr_mtx_ref, color="red", s=10, label="Ref")
plt.ylim(0, 1.05)
plt.xlim(0, 30e3)
plt.ylabel("Indicator Correlation [-]")
plt.xlabel("Distance [m]")
plt.title("Indicator correlation for reference data vs reference data and CML vs reference data")
plt.legend();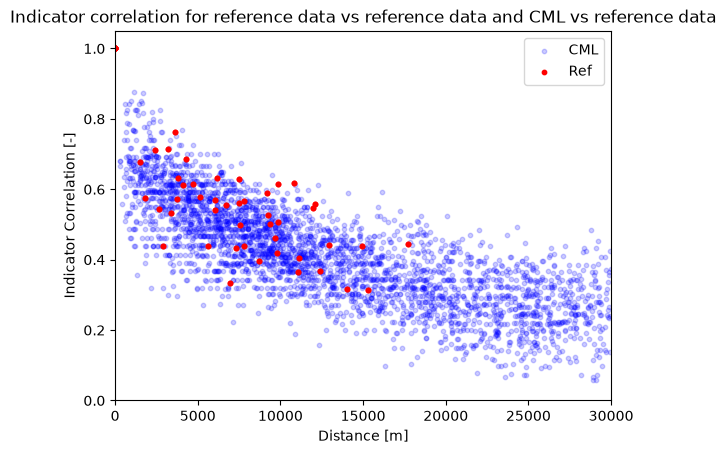
# Filter out CMLs with low indicator correlation
indcorr_results = ic.ic_filter(
    indicator_correlation_matrix_ref=indcorr_mtx_ref,
    distance_correlation_matrix_ref=dist_mtx_ref,
    indicator_correlation_matrix=indcorr_mtx,
    distance_matrix=dist_mtx,
    max_distance=40000,
    bin_size=1000,
    quantile_bin_ref=0.5,
    quantile_bin_pws=0.5,
    threshold=0.0,
);
indcorr_resultsLoading...
print(
    str(indcorr_results.indcorr_good.data.sum())
    + " of "
    + str(len(indcorr_results.indcorr_good))
    + " CMLs were accepted"
)
256 of 364 CMLs were accepted
cml_ids_bad_indcorr = indcorr_results.id_neighbor.where(
    ~indcorr_results.indcorr_good & (indcorr_results.dist.max(dim='id') < 16000), drop=True,
)
cml_ids_bad_indcorr
Loading...
# Plot data of one CML with low indicator correlation
i = 5
cml_id = cml_ids_bad_indcorr[i].data

cml_id = 10058
gauge_id = 'Lbom'

fig, axs = plt.subplots(3, 1, figsize=(6, 10))
plt.sca(axs[0])
indcorr_results.plot.scatter(x="dist", y="indcorr", color="grey", alpha=0.5, s=10, label='all CML vs gauges')
plt.scatter(dist_mtx_ref, indcorr_mtx_ref, color="r", alpha=0.5, s=10, label="gauges vs gauges")
indcorr_results.sel(id_neighbor=cml_id).plot.scatter(
    x="dist", y="indcorr", color="lime", s=15, label=f'CML ID {cml_id:.0f} vs. gauges'
)
plt.legend()
plt.title('')
plt.sca(axs[1])
da_cmls.sel(id=cml_id).plot(label=f'CML {cml_id}')
da_gauges.sel(id=gauge_id).plot(label=f'Gauge {gauge_id}')
plt.legend()

plt.sca(axs[2])
ds_cmls.sel(cml_id=cml_id).isel(sublink_id=0).tl.plot(label=f'CML {cml_id}')
plt.legend()

axs[1].set_title('')
axs[2].set_title('')
axs[1].set_xlabel('')
axs[1].set_xticklabels([]);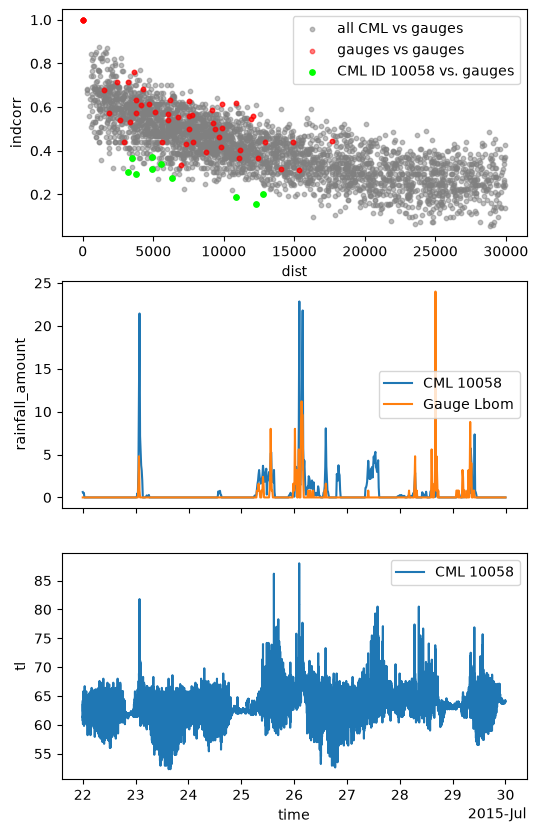
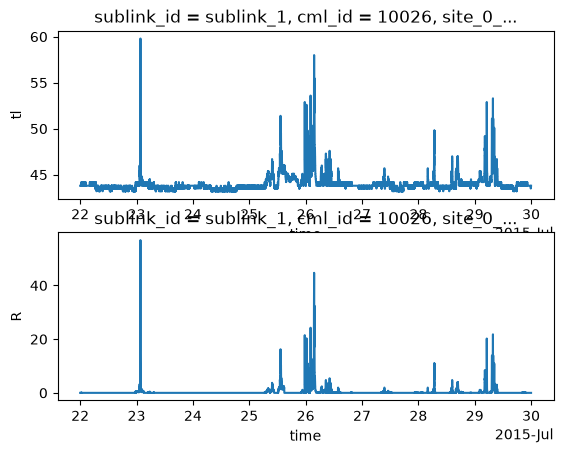
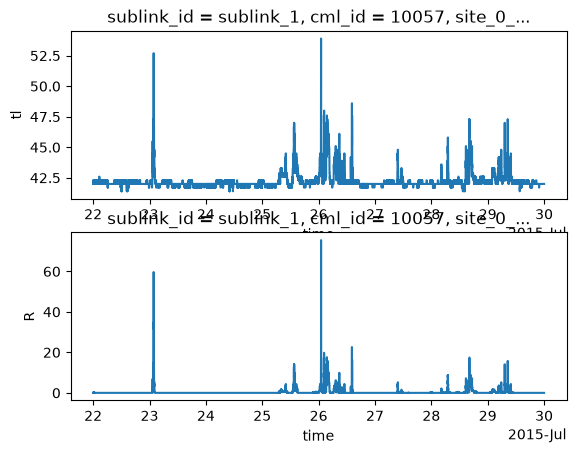
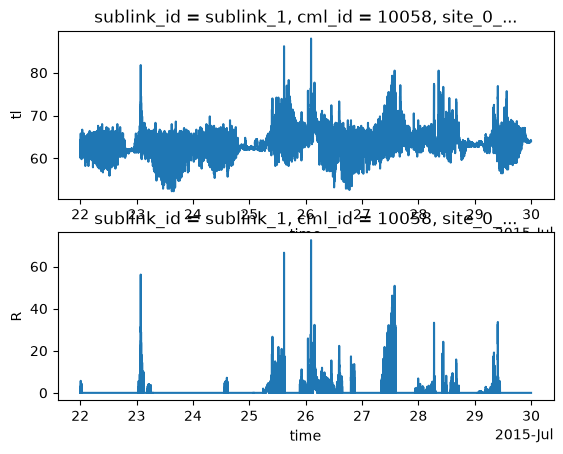
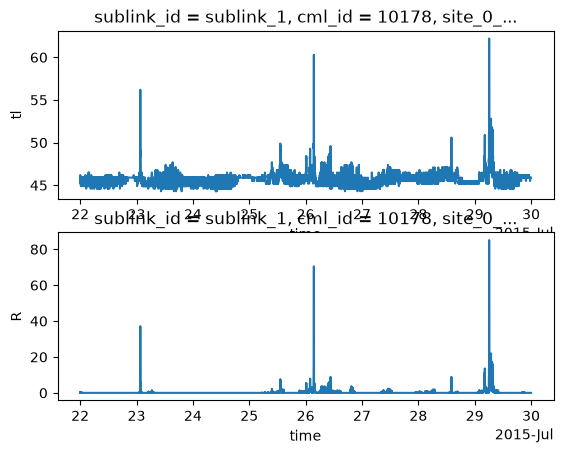
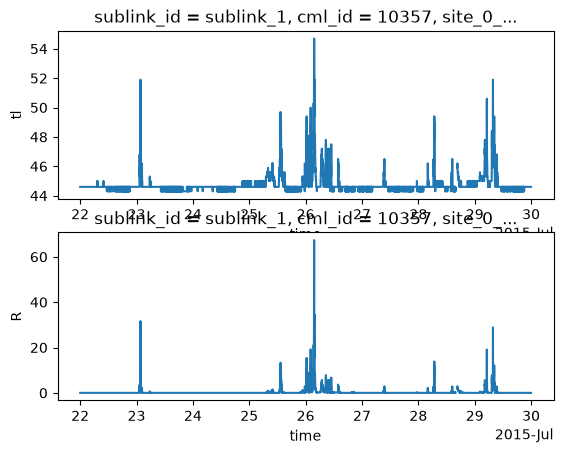
# Plot CMLs with low indicator correlation
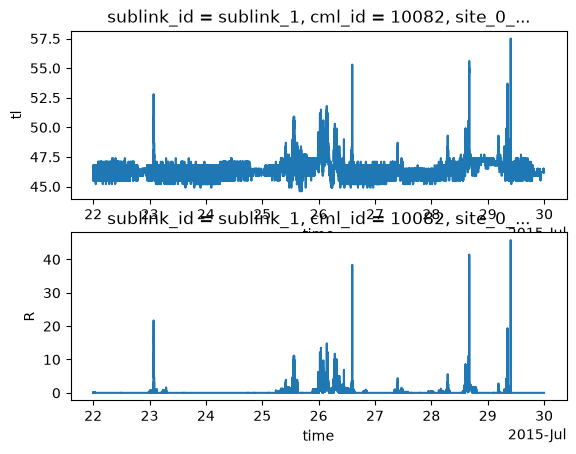
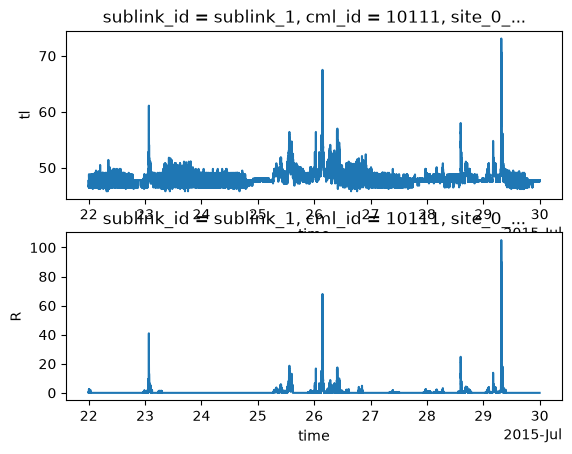
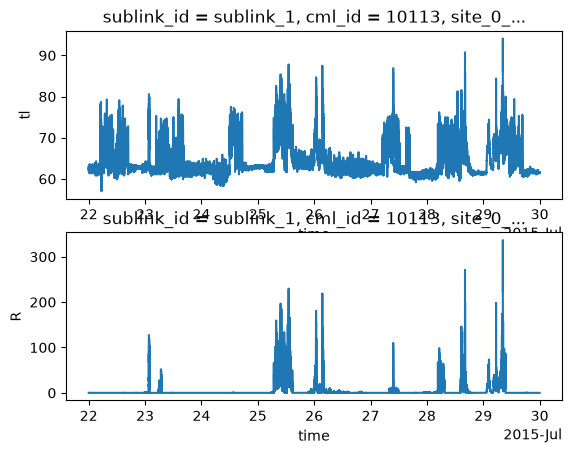
for cml_id in cml_ids_bad_indcorr.values:
    fig, axs = plt.subplots(2, 1)
    ds_cmls.sel(cml_id=cml_id).isel(sublink_id=0).tl.plot(ax=axs[0])
    ds_cmls.sel(cml_id=cml_id).isel(sublink_id=0).R.plot(ax=axs[1])
    plt.show()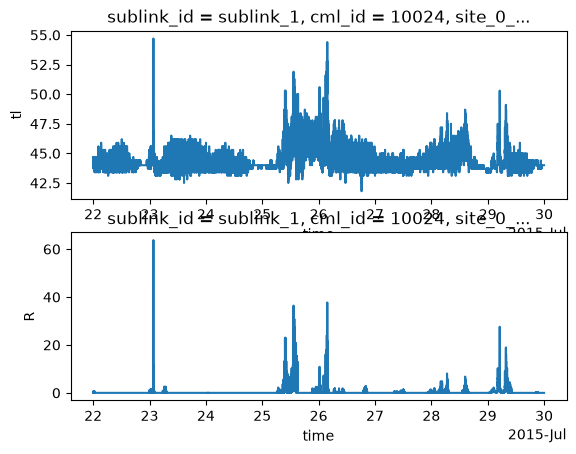
Adjust radar with CMLs using mergeplg
import mergeplg as mrg

# Set up object to get radar values at rain gauges for validation
grid_at_points = plg.spatial.GridAtPoints(
    da_gridded_data=ds_rad.R,
    da_point_data=ds_gauges_municp.rainfall_amount,
    nnear=1,
)

# Set up the merging object which internally calculates
# and stores the CML-radar intersection weights
merge_diff_idw = mrg.merge.MergeDifferenceIDW(
    ds_rad=ds_rad.R,
    ds_cmls=ds_cmls,
    method='additive',
    nnear=12,
)

# Aggregate to 1h
R_radar = ds_rad.R.resample(time='1h').mean()
R_cmls = ds_cmls.isel(sublink_id=0).R.resample(time='1h').mean()
R_gauges = ds_gauges_municp.rainfall_amount.resample(time='1h').sum()

# Do adjustment for one selected timestamp
t = '2015-07-26 03:00:00'
R_grid_idw = merge_diff_idw(
    da_rad=R_radar.sel(time=t),
    da_cmls=R_cmls.sel(time=t),
)

# Get diff of radar and gauges at gauge location
R_rad_at_gauge = grid_at_points(
    da_gridded_data=R_radar.sel(time=t),
    da_point_data=R_gauges.sel(time=t),
)
R_adjusted_rad_at_gauge = grid_at_points(
    da_gridded_data=R_grid_idw,
    da_point_data=R_gauges.sel(time=t),
)

# Plotting the result
fig, axs = plt.subplots(4, 1, figsize=(5, 17), sharex=True, sharey=True)
vmin, vmax = 0, 15
vmin_diff, vmax_diff = -7, 7

plg.plot_map.plot_plg(
    da_grid=R_radar.sel(time=t),
    da_gauges=R_gauges.sel(time=t),
    vmin=vmin,
    vmax=vmax,
    ax=axs[0],
    kwargs_cmls_plot={"line_width": 1},
)
plg.plot_map.plot_plg(
    #da_grid=R_radar.sel(time=t),
    da_gauges=R_rad_at_gauge - R_gauges.sel(time=t),
    vmin=vmin,
    vmax=vmax,
    cmap='Grays',
    ax=axs[1],
    kwargs_gauges_plot={'cmap': 'RdBu', 'vmin': vmin_diff, 'vmax': vmax_diff},
)
plg.plot_map.plot_plg(
    da_grid=R_grid_idw,
    da_cmls=R_cmls.sel(time=t),
    da_gauges=R_gauges.sel(time=t),
    kwargs_cmls_plot={"line_width": 1},
    vmin=vmin,
    vmax=vmax,
    ax=axs[2],
)
plg.plot_map.plot_plg(
    #da_grid=R_grid_idw,
    da_gauges=R_adjusted_rad_at_gauge - R_gauges.sel(time=t),
    vmin=vmin,
    vmax=vmax,
    cmap='Grays',
    ax=axs[3],
    kwargs_gauges_plot={'cmap': 'RdBu', 'vmin': vmin_diff, 'vmax': vmax_diff},
);

axs[0].set_title('Unadjusted radar')
axs[1].set_title('Difference radar - gauges')
axs[2].set_title('CML adjusted radar')
axs[3].set_title('Difference radar - gauges')
axs[0].set_xlim(11.655, 12.255)
axs[0].set_ylim(57.555, 57.845)
axs[0].set_xlabel('')
axs[0].set_ylabel('')
axs[2].set_xlabel('')
axs[2].set_ylabel('')
---------------------------------------------------------------------------
TypeError Traceback (most recent call last)
Cell In[20], line 12
8 )
9
10 # Set up the merging object which internally calculates
11 # and stores the CML-radar intersection weights
---> 12 merge_diff_idw = mrg.merge.MergeDifferenceIDW(
13 ds_rad=ds_rad.R,
14 ds_cmls=ds_cmls,
15 method='additive',
TypeError: MergeDifferenceIDW.__init__() got an unexpected keyword argument 'ds_rad'